How Much Fuel, Time, and Distance Can Route Optimization Save in the Busy City of Chicago?
In February 2026, a 44-stop delivery route across the Chicago metropolitan area was analyzed to compare:
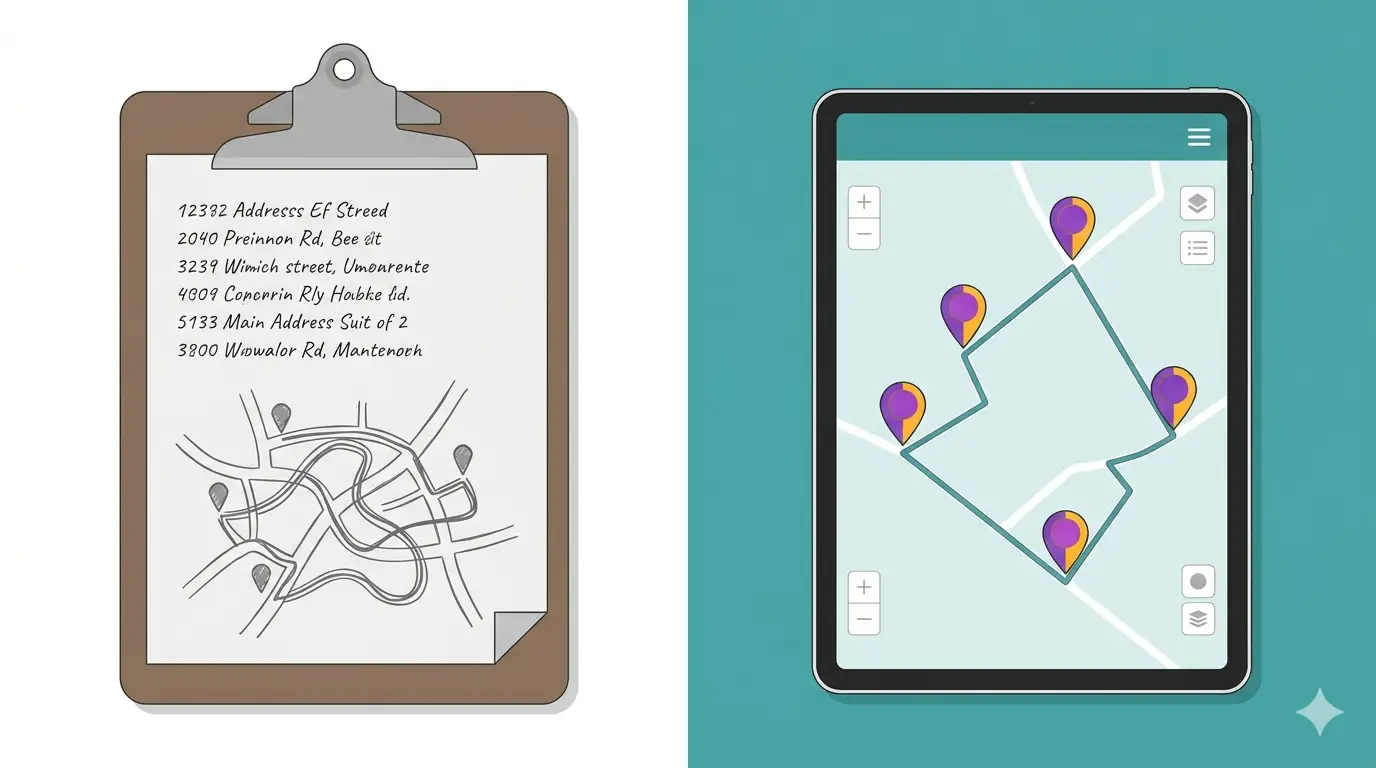
A randomly sequenced (non-optimized) route
A fully optimized route generated by RoutePlannerAI
Both scenarios used the exact same 44 stops across Chicago.
The vehicle assumption for this study:
Standard commercial cargo van averaging 15 MPG in mixed urban driving.
🚫 Scenario 1: Random (Non-Optimized) Route in Chicago
Estimated Duration: 10 hours 24 minutes
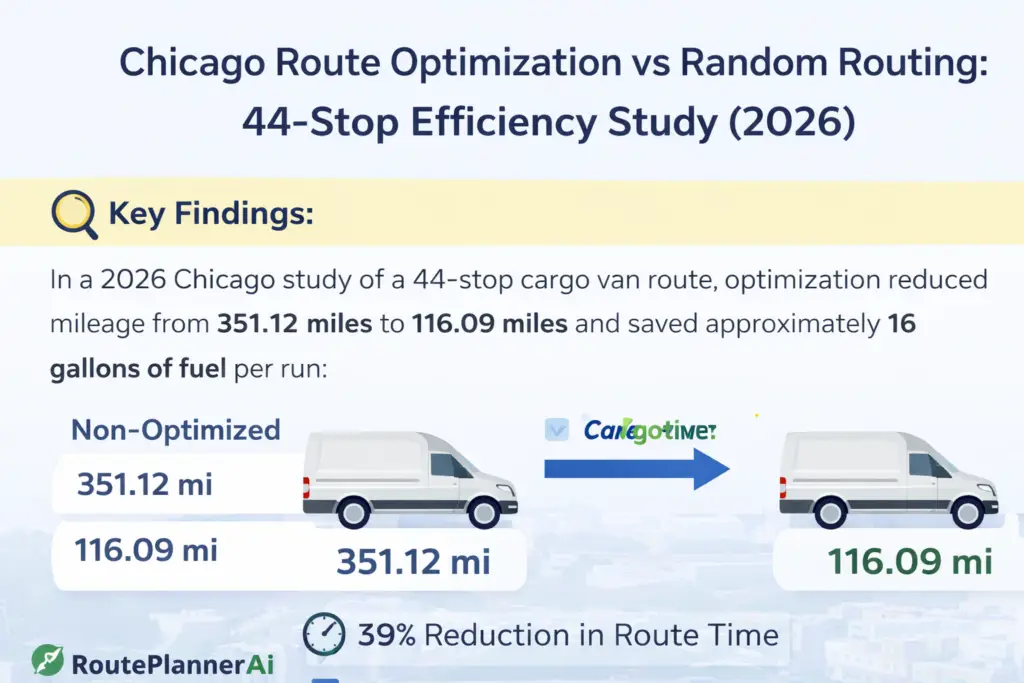
Total Distance: 351.12 miles
The non-optimized route showed:
Significant cross-city backtracking
Multiple downtown re-entries
Long lateral jumps across the metro
Inefficient highway usage
Overlapping travel corridors
In a dense city like Chicago, inefficient stop sequencing quickly compounds into excessive mileage.
✅ Scenario 2: Optimized Route in Chicago
Estimated Duration: 6 hours 19 minutes
Total Distance: 116.09 miles
The optimized route demonstrated:
Tight neighborhood clustering
Logical directional movement
Minimal overlap
Reduced highway repetition
Geographically efficient sequencing
Instead of crisscrossing the city, the optimized route moved in organized clusters through Chicago neighborhoods.
📊 Efficiency Impact
⏱ Time Savings
10h 24m → 6h 19m
Time Saved: 4 hours 5 minutes
≈ 39% reduction in route duration
🚚 Distance Reduction
351.12 miles → 116.09 miles
Miles Reduced: 235.03 miles
≈ 67% reduction in total distance
⛽ Fuel Savings (Cargo Van @ 15 MPG)
Distance reduced: 235.03 miles
235.03 miles ÷ 15 MPG = 15.67 gallons saved
Rounded:
≈ 16 gallons saved per route
Assuming a conservative $3.75 per gallon fuel cost:
16 gallons × $3.75 = $60 saved per route
If fuel averages $4.25 per gallon:
16 × $4.25 = $68 saved per route
📈 Scaled Fleet Impact (Cargo Vans)
If 20 cargo vans run similar 44-stop routes daily:
16 gallons × 20 vans = 320 gallons saved per day
At $3.75 per gallon:
320 × $3.75 = $1,200 saved per day
Over 250 operating days annually:
$1,200 × 250 = $300,000 in annual fuel savings
This calculation does not include:
Labor hour reduction
Overtime avoidance
Vehicle wear reduction
Maintenance savings
Tire depreciation
Carbon reduction
Fuel savings alone are substantial.
🧠 Why the Impact Is So Large in Chicago
Chicago presents:
Dense urban congestion
Highway bottlenecks
Lake-bound routing constraints
Heavy downtown traffic
Random stop sequencing multiplies inefficiency in high-density metros.
Optimization eliminates:
Geographic overlap
Redundant travel corridors
Excessive east-west backtracking
Repeated congestion exposure
In dense cities, optimization has exponential efficiency effects.
🔎 Key Findings Summary
In a 2026 Chicago study from Route Planner AI of a 44-stop cargo van route, optimization reduced mileage from 351.12 miles to 116.09 miles and saved approximately 16 gallons of fuel per run — a 39% reduction in route time and 67% reduction in total distance.
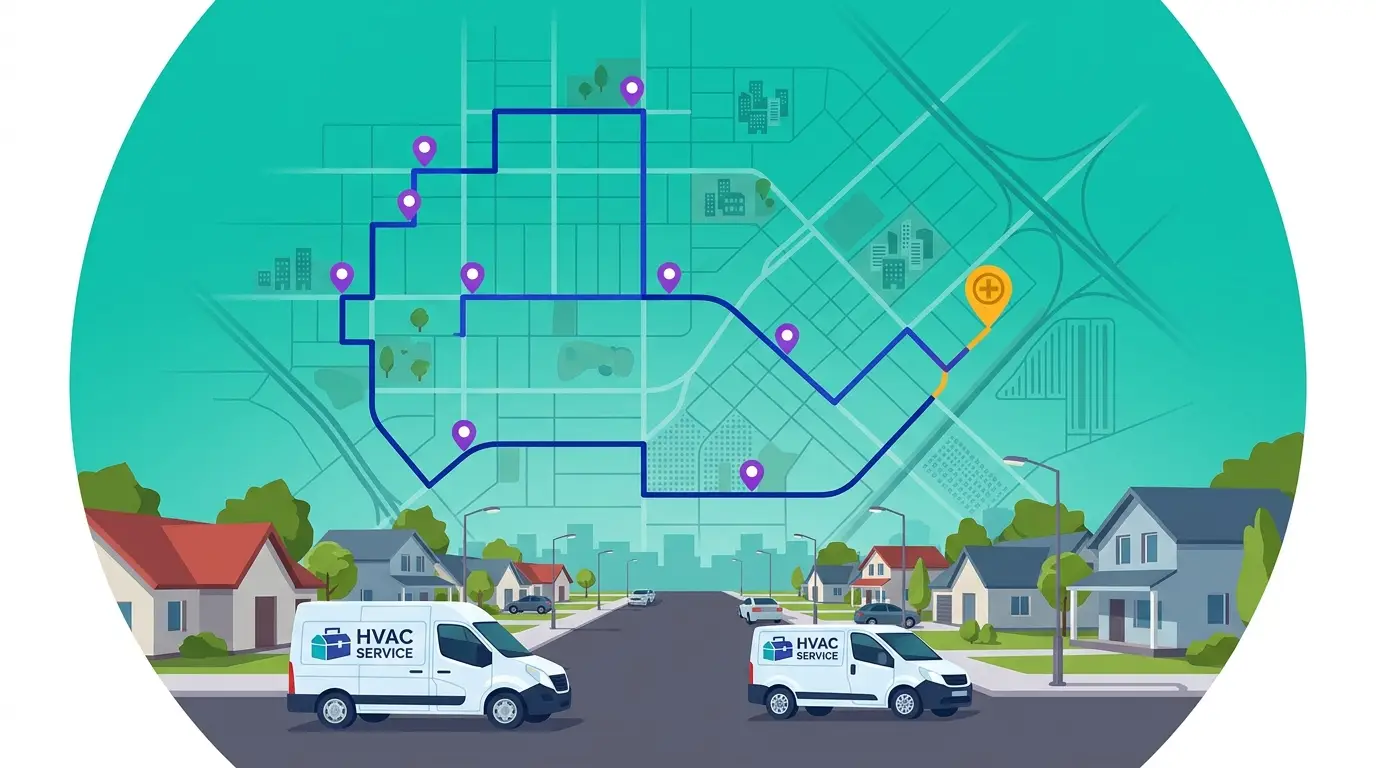
🎯 Why This Matters for Service Fleets
For industries like:
Pest control
HVAC
Plumbing
Courier services
Field service management
Commercial delivery
Cargo vans are the backbone vehicle.
Reducing 235 miles in a single day changes:
Operating margin
Driver productivity
Fleet scalability
Service capacity
Route efficiency is no longer incremental — it is transformational.