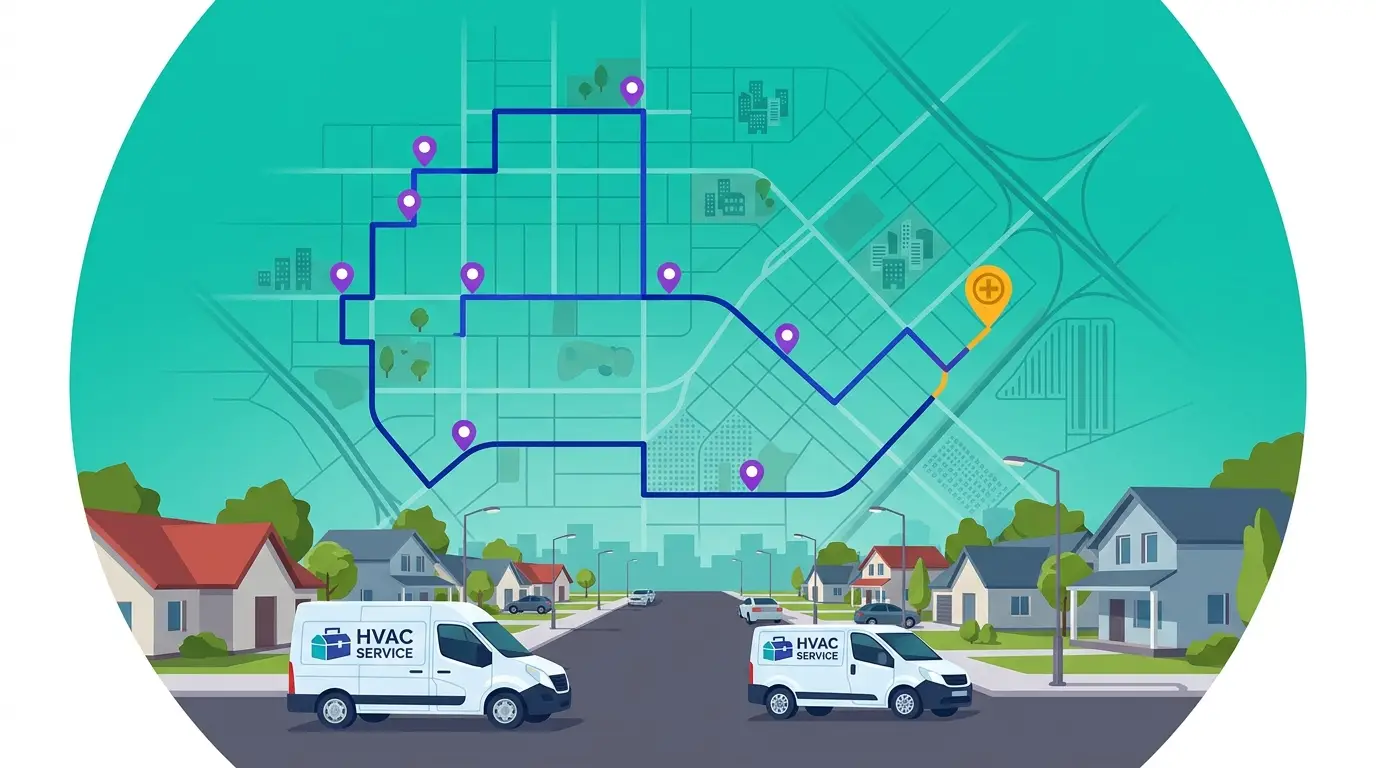
For most pest control operators, drive time isn’t a small line item — it’s the biggest hidden cost in the business. A truck spending 90 minutes on the road between four jobs is a truck spending 90 minutes not generating revenue. Multiply that by every truck, every day, and you’re looking at the difference between a profitable route and a break-even one.
This post walks through the practical levers operators actually use to compress drive time on residential and commercial pest control routes — including the trade-offs that don’t get talked about enough.
Why drive time eats pest control margins faster than other field service work
Pest control has structural disadvantages that compound drive time more than HVAC or plumbing:
Stops are short. A typical residential exterior treatment runs 15 to 25 minutes. When the stop itself is short, the ratio of windshield-to-wrench time skews badly — often half the workday on suburban routes. That’s not the case for HVAC, where a service call might be 45 to 90 minutes and dwarfs the drive between jobs.
Routes are recurring. Most pest control work is monthly, bimonthly, or quarterly. Once a route is built, it tends to get re-run with minor edits, week after week. That means inefficiencies don’t just hurt one day — they get baked in and replay every cycle.
Customer windows are often loose. Residential pest control rarely has tight delivery windows, which sounds like an advantage. But it actually means there’s no forcing function pushing operators to optimize sequencing — so the path from yesterday becomes the path for today, even when geography has shifted.
The result: most pest control routes carry meaningful drive-time slack that operators don’t notice — because the inefficiency is invisible. It just looks like “how long the route takes.”
The five levers that actually reduce drive time
Here’s what operators do when they’re serious about compressing windshield time. In rough order of impact:
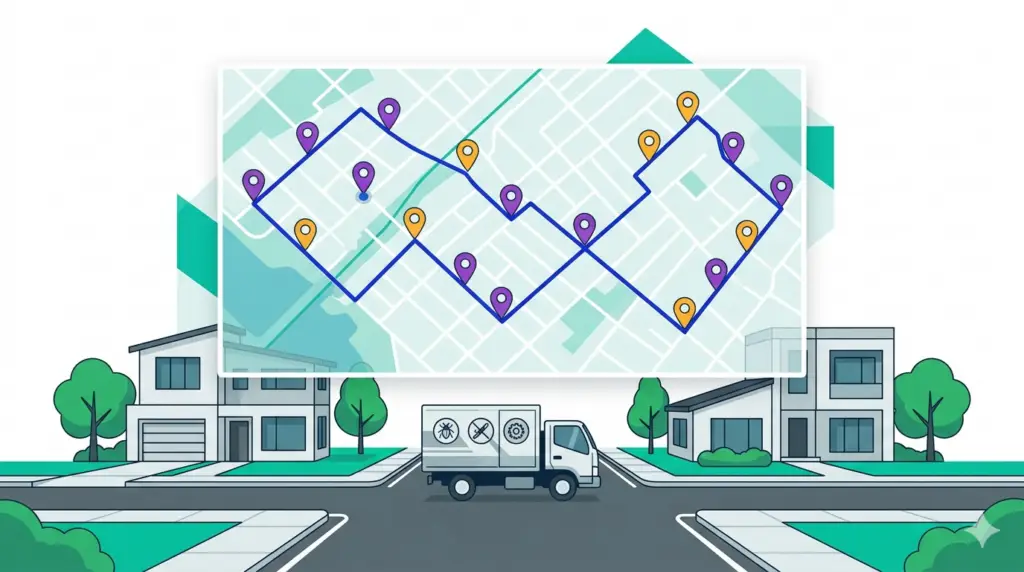
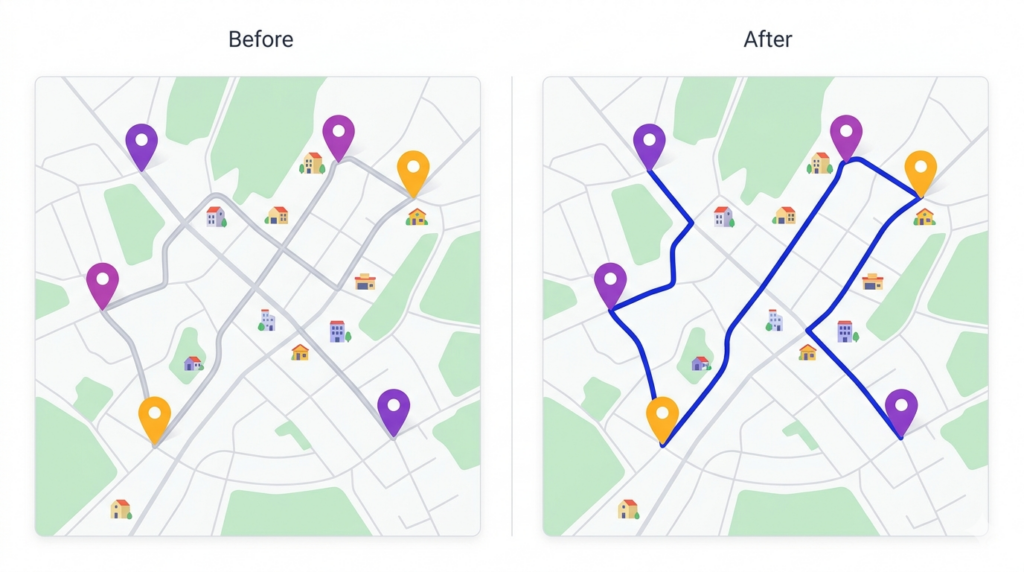
1. Reoptimize the stop sequence (not just the stop list)
The biggest, fastest win is sequencing. If you’re running a route built six months ago — or worse, a route inherited from the previous tech — you’re almost certainly visiting stops in an order that no longer makes geographic sense. Customers cancel, new ones get added, neighborhoods densify. A route that was efficient last spring isn’t efficient today.
Reoptimization isn’t about adding or removing stops. It’s about asking the routing engine to resequence the same stops based on current geography. On a typical 30-stop residential route, the savings show up the day you run the new sequence — and they compound across every cycle the route is rerun.
This is the single change with the highest ROI and the lowest implementation friction. If you do nothing else from this list, do this.
2. Tighten territory boundaries
Drive time balloons when techs cross territory lines. Often this happens organically — a customer in tech A’s territory cancels and tech B picks them up, but that customer now sits well outside tech B’s normal route. One stop costs significant drive time, both ways.
A quarterly territory audit catches this. The question to ask: for each tech, which stops are more than three miles from any other stop on their route? Those are the cleanup candidates. Either reassign them to the tech they actually fit, or consolidate the strays into a half-day “edge cleanup” route once a month.
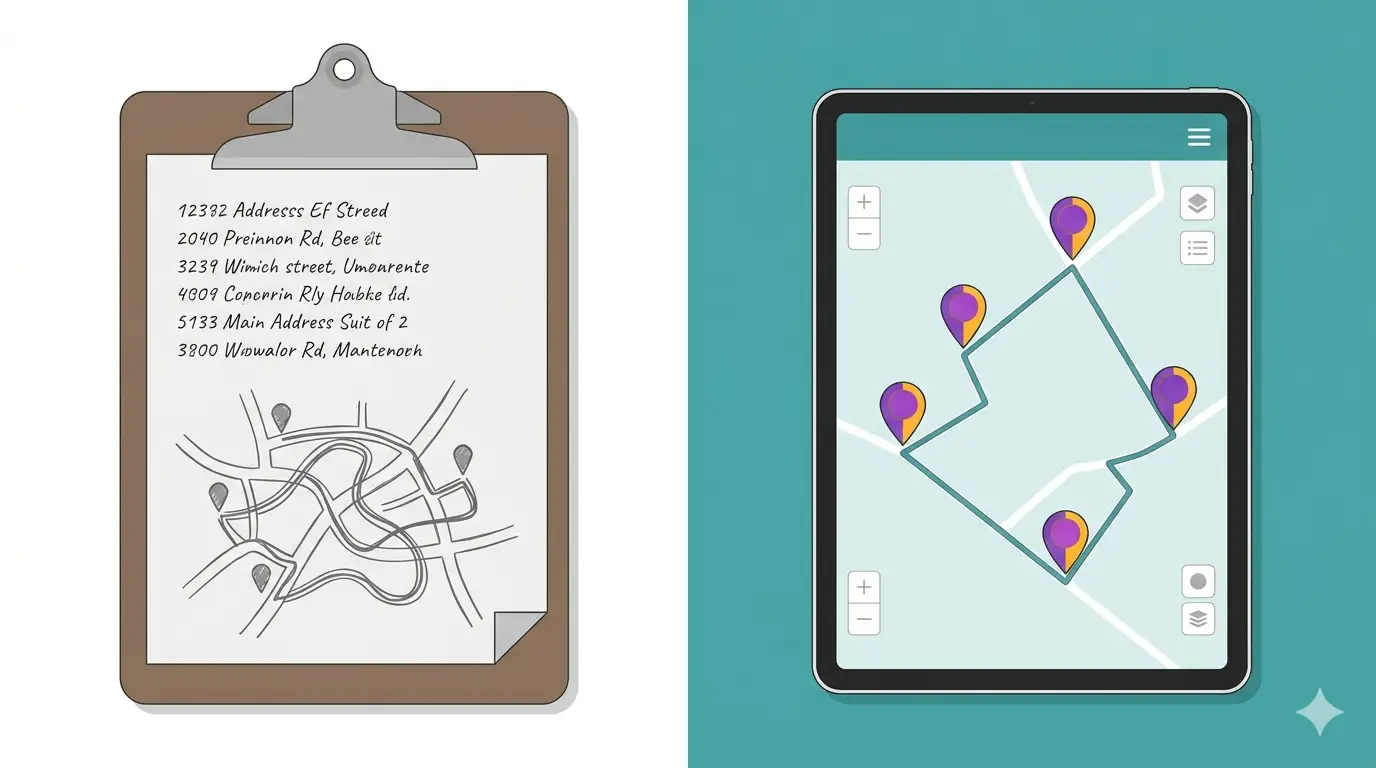
3. Stop building same-day routes from scratch
Most operators rebuild routes the morning of. This sounds responsive, but it usually means routes get sequenced quickly under time pressure, with the office manager dragging stops around in whatever order looks “close enough.”
Build a master template route per zone, then make daily edits off the template. The template captures the optimal base sequence; daily edits handle one-offs, cancellations, and add-ins. This is faster than building from scratch and produces consistently better routes.
4. Cluster recurring frequencies on the same day
If you have 200 monthly customers spread across a service area, the worst possible plan is 10 monthly customers per day spread across all 20 service days. The best plan is to group monthly customers geographically — all the monthly stops in the north zone get hit on the same day, all the monthly stops in the south zone on a different day.
This sounds obvious, but a surprising number of operators have grown into a schedule where customer day-of-week assignments were made based on signup order, not geography. Re-clustering by location tends to take meaningful time off the monthly drive total.
There’s a customer-communication cost — you’re shifting service days for some customers, which requires outreach. But for operators with 100+ monthly customers, the savings usually pay for the disruption within a quarter.
5. Use real drive-time data, not straight-line distance
Most “smart” route planning still falls back on straight-line distance for sequencing decisions. That’s fine in flat suburbs, but in any market with rivers, highways, school zones, or one-way streets, straight-line distance lies. The shortest route on a map can take longer to drive than a slightly longer alternative.
Modern routing engines use historical drive-time data, often pulled from Google Maps’ traffic models. If yours doesn’t, that’s a meaningful upgrade. The difference shows up most in dense urban routes and in markets with predictable rush-hour patterns.
What doesn’t work as well as people think
A few drive-time “fixes” sound good but don’t move the needle much in practice:
Adding more techs. This reduces stops per route but only marginally reduces drive time per stop. The drive between jobs stays roughly the same; you just have more trucks doing it. This is a capacity solution, not a drive-time solution.
GPS tracking alone. GPS tells you where techs were — useful for accountability and for spotting outlier days, but it doesn’t actually reduce drive time. Without route optimization layered on top, GPS is just a dashboard.
Telling drivers to “drive faster.” The biggest variable in drive time is route sequence and territory design, not vehicle speed. Pushing techs to compress drive time without giving them better sequencing is a recipe for frustration and missed stops.
Where software fits in
A route CRM handles the sequencing, territory analysis, and customer-day-of-week clustering work above without an office manager rebuilding routes by hand. The basic flow:
- Import your customer list — addresses, service frequencies, special instructions
- Define your service zones and assign customers to days
- Let the optimizer sequence each day’s stops based on real drive-time data
- Push the route to the tech’s phone so they can navigate stop-to-stop without thinking about order
- Update the route mid-day when cancellations or emergencies come in, without rebuilding the rest of the day from scratch
Pest control routing software — the category Route Planner AI sits in — exists specifically because the manual process breaks at scale. One truck with 12 stops? Manageable on paper. Five trucks with 25 stops each? That’s 125 sequencing decisions a day, and even small improvements compound across hundreds of monthly visits.
What “good” drive time looks like for pest control operators
There’s no universal benchmark — drive time depends heavily on customer density, territory size, and stop length. As rough operator rules of thumb for residential pest control:
- A drive-to-stop ratio under 40% is healthy. (For every hour worked, less than 24 minutes is windshield time.)
- A drive-to-stop ratio over 60% signals route or territory inefficiency. Half the workday is being burned on the road.
- Stops per truck per day in the 18–28 range is typical for monthly residential routes. Below 15, drive time is probably the bottleneck. Above 30, stop length might be too short to support route quality.
If you’re tracking these numbers — and a lot of operators aren’t — they’re the early warning system for territory drift and route decay.
Frequently asked questions
How much can pest control operators reduce drive time?
It depends on starting point. Operators running unoptimized monthly routes typically see the biggest gains from a single reoptimization — enough that fuel and labor savings cover the cost of switching to route planning software within the first month. Operators already using basic optimization see smaller but compounding gains from territory cleanup and frequency clustering.
Is route optimization worth it for a one- or two-truck pest control operator?
Below three trucks, manual planning with Google Maps and a notebook is workable — though usually inefficient. The break-even point where dedicated route planning software pays for itself in time and fuel savings is typically around the three-truck threshold. Above that, the math almost always works out.
Does pest control routing software handle recurring service frequencies?
Yes — the right software lets you assign each customer a recurrence (monthly, bimonthly, quarterly) and automatically slots them into the correct day’s route, then resequences the day for optimal drive time once all stops are placed.
Getting started with Route Planner AI
Route Planner AI gives pest control operators the route optimization, territory management, and recurring-frequency clustering described above — without enterprise software complexity. Plans start at $39.99 per driver per month.
If you’re currently planning routes by hand and you’ve crossed the three-truck threshold, the first reoptimization usually pays for the software within the first month in fuel and labor savings alone. Start a free trial to see what your current routes look like once they’re properly sequenced.